College Management System
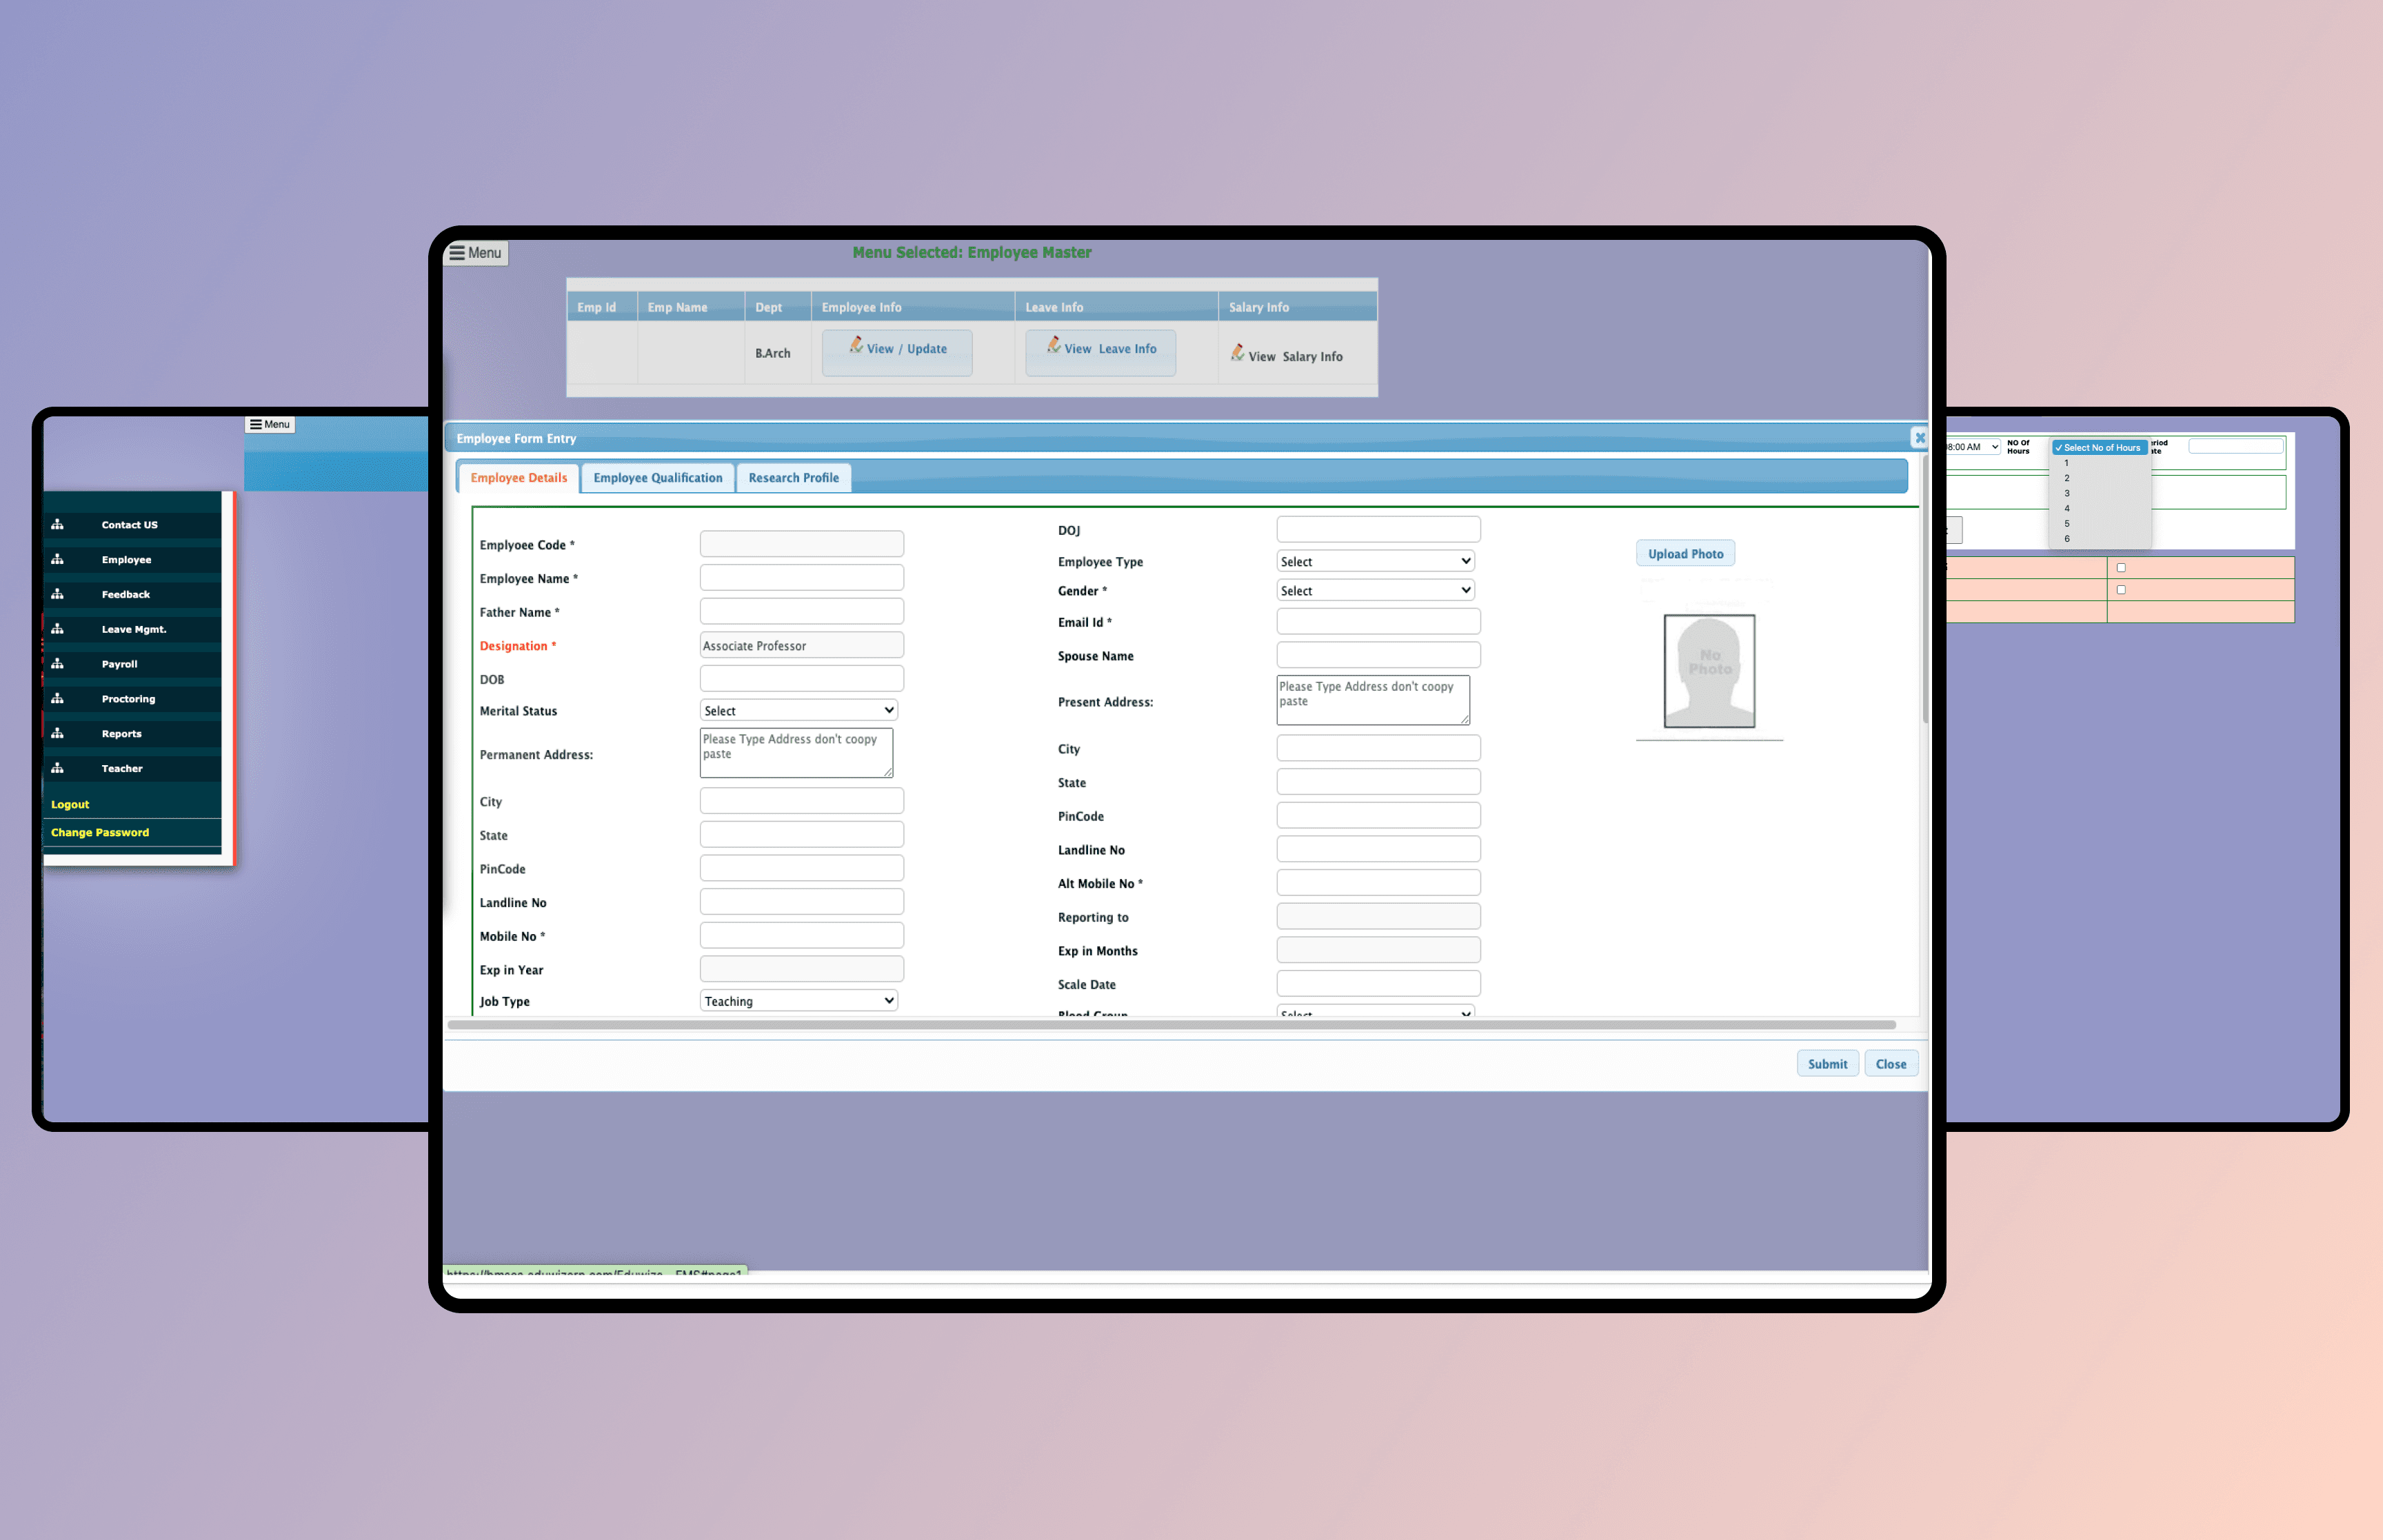
A 600-student architecture college still ran on paper — attendance, leave, records, all by hand. As the ERP technical lead, I spent two years moving it from paper to pixels, designing digital workflows that felt like the forms they replaced — familiar enough that faculty actually adopted them. The queue outside the director's office, the unofficial measure of approval delays, disappeared within months.
Running a college on paper
BMS College of Architecture — 600 students, 50 faculty — ran its core administration on paper. Attendance, leave management, academic records: all manual, all slow, and increasingly a bottleneck on day-to-day operations.
I taught there as an assistant professor, which put me in both the teaching and the administrative chair — a useful vantage point on exactly where the paper workflows broke down. So when the college decided to adopt an ERP, I was made technical lead: identify the problems, propose the system, and lead its customisation and rollout.
The brief wasn't just to digitise what existed. It was to rethink the workflows for speed and better decision-making — without alienating the faculty who'd used the paper versions for years. This case study focuses on one module in depth: Leave Management.
Digitising without flattening the nuance
The goal was a comprehensive college management system. The hard part wasn't the software — it was preserving the judgement and exceptions baked into processes that had grown up on paper. Three challenges defined the project:
Complex, interconnected workflows
Off-the-shelf software that didn't fit
Data accuracy and access
What we set out to achieve
- Streamline administration by automating routine academic processes.
- Sharpen decision-making with accessible data and insight.
- Improve data management — accurate records, available to the right people.
- Increase transparency and accountability across approvals and records.
- Lift operational efficiency with a proper student information system underneath it all.
Learning the workflows from the inside
My research leaned on something most projects don't have: intimate, first-hand knowledge of the ecosystem. I was a user of these paper processes myself. That let me investigate practically rather than formally.
- Contextual observation. Watched colleagues work in their actual environment, seeing where the paper forms and records slowed them down.
- Informal interviews. Talked with faculty and staff about pain points and the changes they actually wanted.
- Workflow mapping. Documented the existing processes step by step, surfacing inefficiencies and the spots ripe for digitising.
- Iterative testing. Released early versions to a small group of users and let their real-world feedback drive continuous refinement.
This wasn't textbook UX research with formal protocols. But being inside the institution gave me rich, contextual data — and a system tuned to how the college genuinely operated, not how a process diagram assumed it did.
Ship small, roll out slowly
Change resistance was the real risk, not the technology. So the approach was built around adoption: small releases, gradual rollout, heavy customisation, and steady support.
Rapid prototyping
Gradual rollout
Custom solution
Ongoing support
Rebuilding leave around how it really worked
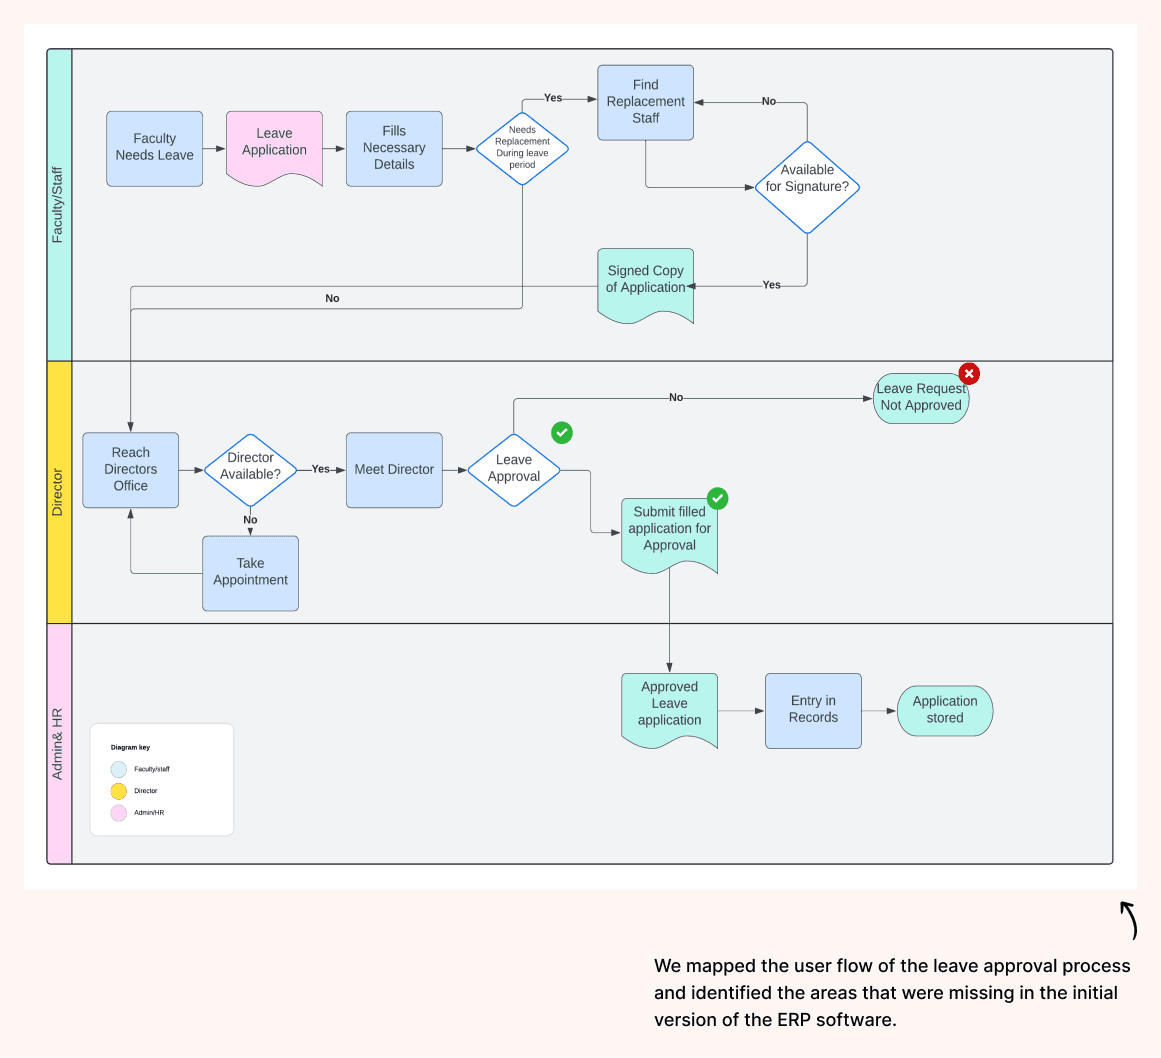
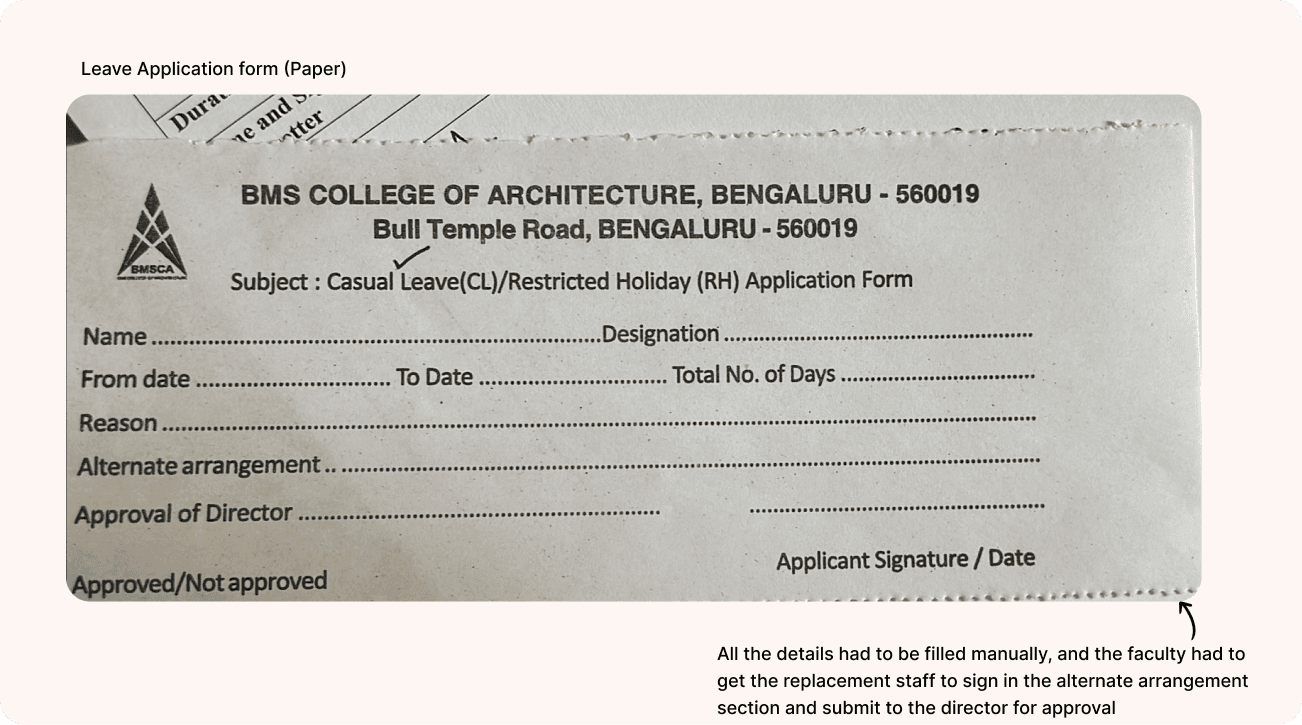
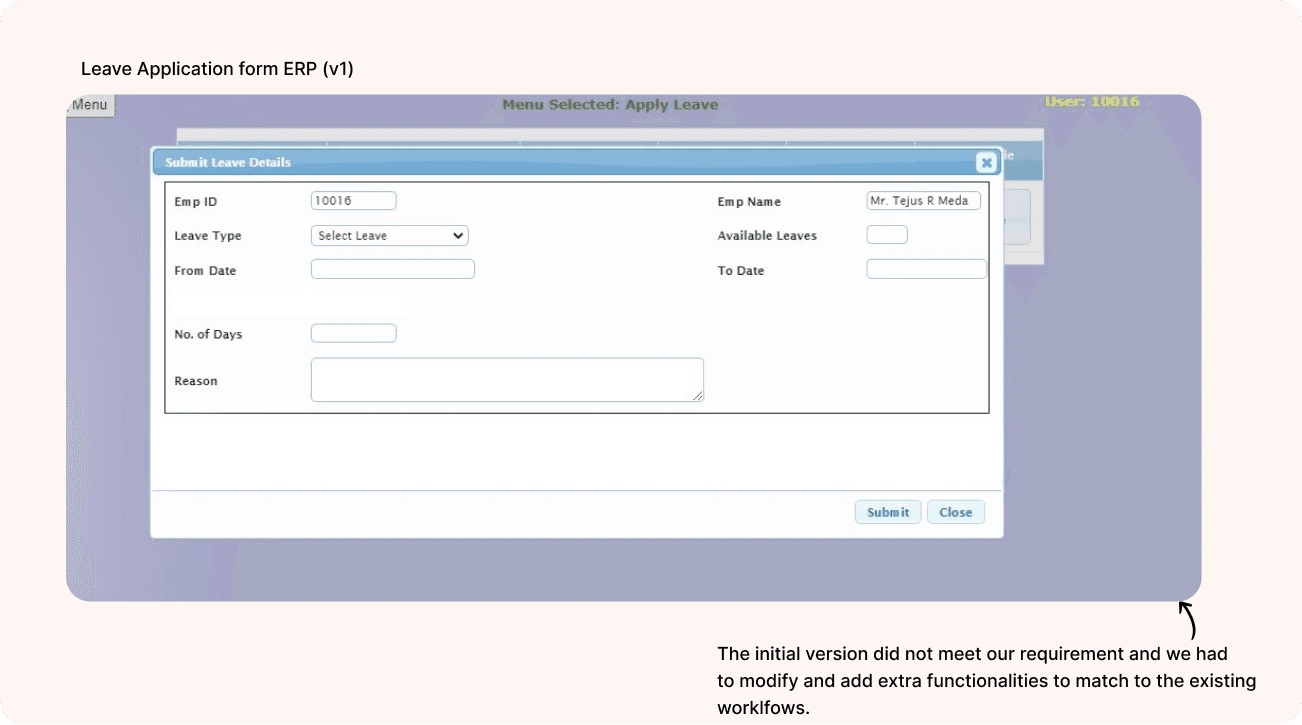
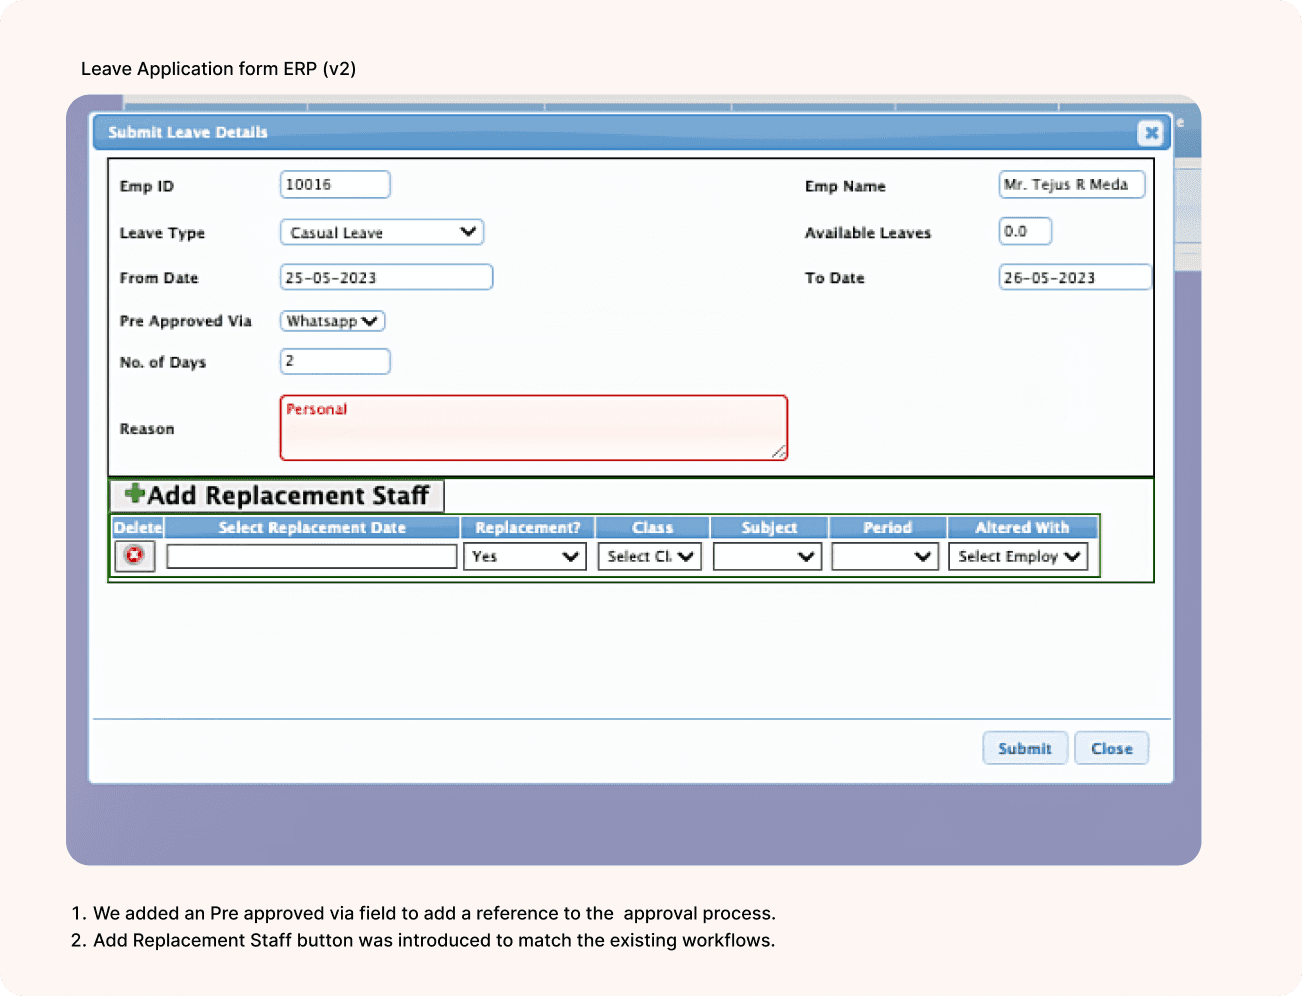
The vendor's standard leave module didn't apply to us — sanctioning faculty leave involved more parameters and a few extra steps before an application could even go for approval. So I mapped our real paper process into a flow diagram, then reshaped the digital module to match it. Watching the flow made it clear: a few new fields were needed to make the digital process feel like the paper one it replaced.
A “Pre-approved via” field
An “Add replacement faculty” option
What changed after the redesign
- Faculty could apply from their own laptop, phone, or tablet — no trip to the office.
- Leave balances were visible instantly, not buried in a ledger.
- Clearer accountability for the institution's administration.
- Cleaner tracking of leave for salary calculations.
- No more waiting outside the main office for the director's sign-off.
- The digital flow felt familiar, easing the move off paper for less tech-savvy staff.
- The director could finally see any employee's full leave history.
What digitising actually moved
- The queue outside the director's office disappeared. Leave approvals that used to take days became same-day decisions through digital routing — the informal signal everyone used to gauge backlog.
- Attendance stopped being a manual compilation job. Faculty logged it digitally; the system surfaced summaries automatically, removing the entry and end-of-week compilation that had taken up admin time.
- Students could check their own records instantly. Grades, attendance, and course information were available on demand — no more queuing at the admin desk for a printed summary.
- Paper consumption across core workflows fell sharply. As digital alternatives embedded into daily practice, the college's reliance on paper-based admin reduced across leave, attendance, and records.
Where it could go next
Technology and the college's needs would keep evolving. A few directions stood out for extending the system:
- Real-time notifications. Alert users to updates, deadlines, and changes as they happen.
- A refined interface. Keep improving the UI against accumulated feedback and real usage data.
- Predictive analytics. Forecast student performance and assess faculty effectiveness to support better planning.
What two years taught me
User feedback shapes adoption
Continuous input was decisive. Even small adjustments off the back of feedback noticeably improved adoption and satisfaction — regular check-ins and open channels with faculty and students let us catch and fix pain points fast.
Phased implementation works
Rolling out gradually made adoption smoother and gave us room to refine. Introducing features incrementally managed change-resistance and let us prioritise the critical pieces while learning for the next phase.
Balance innovation with familiarity
The biggest lever was designing digital interfaces that mirrored the paper processes where possible. That familiarity eased the transition for less tech-savvy users while still delivering the upside of going digital.
Data makes better decisions
Centralised, accessible data let administrators make more informed calls on resourcing, planning, and student support — a reminder that the point isn't just digitising processes, but using what they generate.